
Introduction
VOIS is a python library to simplify the creation of Voilà dashboards. It contains functions and classes that allow for fast development of data analytics dashboards containing charts (using Plotly python library), datatables from Pandas DataFrames, SVG plots, and interactive maps.
The library contains an example dashboard that is built step by step using the functions and classes of the vois library. This example dashboard displays, in various modes, data on energy consumption of the european countries. Data used by the example dashboard was downloaded from EUROSTAT.
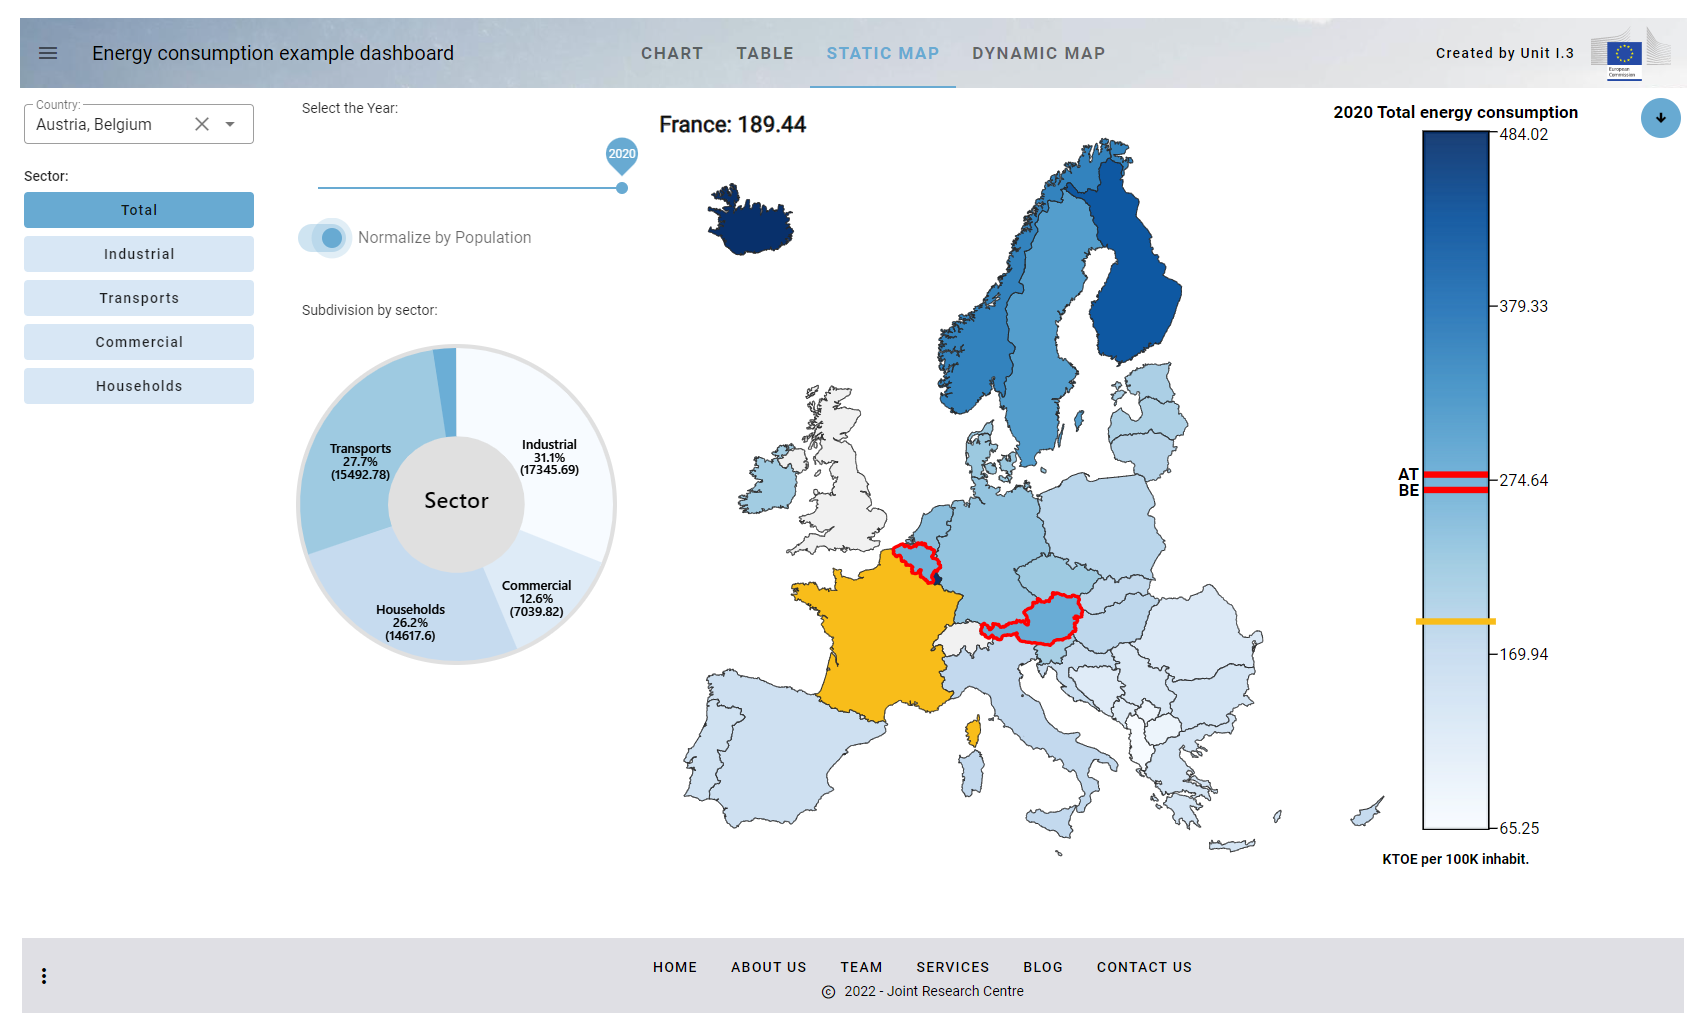
Fig. 1 Energy consumption example dashboard
News
In order to help new users of the vois library to start using the library without the need to read all the documentation, we have created two dashboards that help in visually define a multipage application structure.
These tools are deployed as Voilà dashboards in Microsoft Azure Cloud at this URL: https://vois.azurewebsites.net/

Fig. 2 Vois Helpers dashboard
The “Main Page Configurator” is a visual tool to create the starting page of a multipage application, by visually position titles, logos, buttons, credits on top of a background image. Sixty predefined background images are available but also custom background images can be uploaded. The result of the visual configuration can be saved locally as a json file and a notebook .ipynb file and immediately used as the first building block of your application.

Fig. 3 Main Page Configurator
The “Page Configurator” enables the visual configuration of one of your application pages. Users can define the colors, the logos, the content of the page (one or more maps, charts, drawings, etc.) and the number of panels that will contain the widgets that control the application behaviour. Once done, the page configuration can be downloaded locally as a json file, a pyton file and a notebook, and immediately used in JupyterLab.

Fig. 4 Example of a page with a left panel and a bottom panel. The content of the page consists of two maps and a chart.
Widgets libraries
Widgets are the part of a GUI that allows the user to interface with the application. Widgets can make Jupyter notebooks look lively and interactive. Widgets are elements like buttons, drop-down list, slider, etc.
Widgets allow users to interact with the notebook, manipulate output according to the selection of widget and controlling events. It can be used to record the user’s input and can be implemented easily in a Jupyter notebook.
Ipywidgets is an open-source python library that is used to generate different types of widgets and implement them in a Jupyter notebook. It is easy to use and provides a variety of interactive widgets. It is the “traditional” way to create GUI elements inside a Jupyter notebook, and is the first choice when a dashboard has to be built.
Fig. 5 Some of the standard ipywidgets GUI elements
The look&feel of the ipywidgets, however, cannot be customized, and when there is the need to create fancy looking applications in Jupyter or Voilà, more modern widgets library come to play their role.
For this reason vois library uses primarily Ipyvuetify as the widgets base library.
Ipyvuetify is a widget library for making modern looking GUI’s in Jupyter notebooks and dashboards (Voilà). It’s based on the Google material design philosophy best known from the Android user interface. A large set of widgets is provided with many widgets having multiple variants.
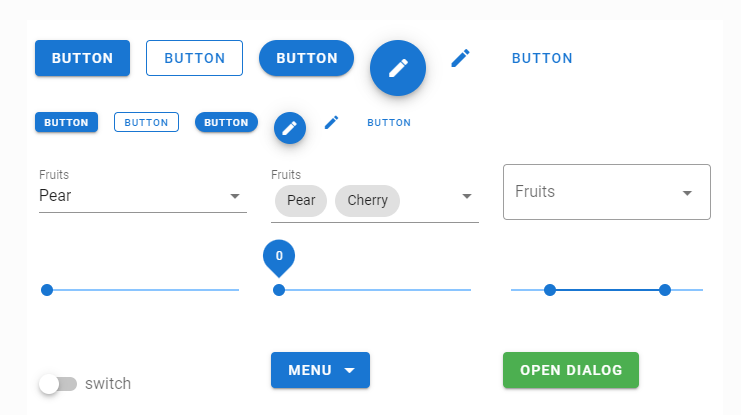
Fig. 6 Ipyvuetify sample widgets
To explore which widgets are available in ipyvuetify and how to use them it is useful to view the Vuetifyjs documentation where a very datailed description of the components can be found. You can browse examples on the left-hand side and see the source code by clicking on ‘< >’ on the top right-hand side of the example. By reading the Usage section of ipyvuetify documentation you will be able to translate the examples to ipyvuetify.
When comparing ipyvuetify to ipywidgets, the standard widget library of Jupyter, ipyvuetify has a lot more widgets which are also more customizable and composable (in term of colors, shapes, functions, etc.) at the expense of a bit more verbosity in the source code. Using ipywuetify requires more effort compared to ipywidgets. For this reason, one of the main scope of this vois library is to simplify the use of ipyvuetify widget, so that the development of fancy Voilà dashboards becomes easier.
Packages
The vois library is grouped in these packages:
Contains modules that define utilities functions and classes of general use (geojson, maps, svg, etc.) |
|
Contains modules that define classes to simplify the creation of GUI elements using ipyvuetify widgets |
|
Contains modules that enable the display of geospatial content on an interactive Map |